Dollar Wise Decisions

Sunday, November 26, 2006

The Financial Sector - Beyond the Stars

Having quickly learned the limitations of the Morningstar (M*) rating system I find myself now leaning towards other criteria. We showed in previous post that a one star rated stock can appreciate as readily as a five star rated stock.
Anyway -this post is more of a notepad ...I've been screening stocks and figured I could keep some of the data blogged here.
I did a basic screen to look for companies with a wide Economic Moat and Low Risk. That screening resulted in 59 companies.
as an aside - the S&P 500 holds over 1/5th of it's stocks in the Financial Services Sector - 21.39% according to M*.
My Taxable Portfolio contains 4.22% in the financial industry which is due to Alleghany (Y) and Wilmington Trust (WL) - Alleghany is set up for automatic monthly purchases via SoGoInvest.com and Wilmington is a DRIP (absolutely NO fees!) which I recently set up for automatic monthly purchases. I'd like to add Bank of America (BAC) and in a practice portfolio I had analyzed, I also added Nuveen Investments (JNC), Blackrock (BLK) and Student Load (STU) then equalized my holdings and found that adding those three financial stocks (w/ equal weighting) would bring my exposure to the Financial Sector up to 21.40% - so, six companies among the financial industry which would make up 21.4% would mean about a 3.56% exposure per each of the six companies - cash and two high yield bond funds would make the exposure around 3.23%.

Found some interesting things - I like to look at the number of years a company has had increasing revenues year after year and maintained positive earnings per share.
When I did a screen looking for Financial companies w/ 10 years of increasing revenues, some sort of economic moat (either narrow or wide) along with low risk I end up with 7 companies - three of which I've already mentioned - namely Nuveen Investments (JNC), Student Loan (STU) and Wilmington Trust (WL).

If we change the criteria from Low Risk to anything of Average Risk or lower, we then get 41 companies returned which also includes Eaton Vance (EV)
Now, we'll take a cursory look at the star rating along with a few other attributes;

Blackrock (BLK) - 1* - Mid Growth - Aggrestive Growth - BA Risk
Eaton Vance (EV) - 3* - Mid Growth - Classic Growth - Ave Risk
Nuveen (JNC) - 3* - Mid Growth - Classic Growth - BA Risk
Student Loan (STU) - 5* - Mid Core - Classic Growth - BA Risk
Wilmington Trust (WL) - 3* - Mid Value - Slow Growth - BA Risk
Bank of America (BAC) - 4* - Large Value - High Yield - Ave Risk
Alleghany (Y) - 4* - Mid Core - Speculative - Ave Risk


There has been an intentional look into the Non Large Cap stocks ...
Of those stocks mentioned above
EV, JNC, STU & WL all fall into the 10 years screening of increasing revenues & positive earnings.
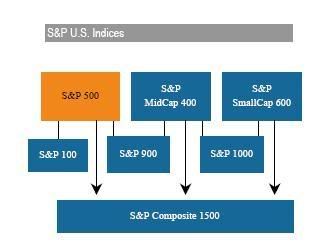
Perhaps somewhat of a developing theory but, the initial criteria for a stock to be considered in the S&P 400, is that it's market cap should be in a range of 1 - 4.5 billion dollars while initial inclusion into the S&P 500 is for market caps in excess of 4 billion dollars. We may note however, that all of the top 10 companies in the S&P 400 are well in excess of the initial criteria of 4.5 billion so, there is forward thinking that if a company in the S&P 400 continues to grow that it will eventually be moved to the S&P 500 which has much greater exposure to the buying public and, as such, would be very positive for stock price growth.

I know Cognizant Technology Solutions (CTSH) was the top market cap stock in the 400 but was recently moved to the 500. After CTSH we have Peabody Energy and Expeditors International (EXPD) as top holdings - and, as fate would have it - I own EXPD.
Looks like CTSH was changed on 11/13/06

btw - BLK, EV and JNC all have 1, 3 & 3 stars respectively but what I am more emboldened with now is the change in their Fair Value Estimate (fve) - here's how that's changed for each company over the past 5 years
BLK - fve raised 10x since Nov '03
EV - fve raised 10x since May '03
JNC - fve raised 10x since Jan '03

The best part about the fve provided by M* is that the market has concurred and stock prices have risen along with the M*'s fve.

Friday, November 24, 2006

Fri 11/24/06 Updates

Major Markets; DWDI, LISA, SPDRs & Diamonds Day Ending Scores
Market

% Change

Value

Dow

-0.38%

12,280.17

S&P 500

-0.37%

1,400.95

NASDAQ

-0.23%

2,460.26

...
DWD Indexes..
DWDI

-0.43

1,066.14

LISA

-0.74

1,048.45

Warm & Fuzzy

-0.49

1,103.91

Ambitious

-0.23

1,064.88

SoGo 7 Index

-0.61

1,165.39

.. .
Benchmark Indicies..
Diamonds DIA

-0.46%

1,048.55

Spiders SPY

-0.40%

1,067.54


Personal Portfolio - Taxable-0.54
Personal Portfolio - Retirement+0.17
Skip's List-0.42

Daily recap for the 10 Stocks that make up the Dollar Wise Decisions Index (DWDI)
Stock

% Change

Value
Anheuser-Busch

-0.52

98.16
Biomet

-0.84

117.38
Fastenal

-0.09

97.66
Home Depot

-1.00

104.90
Johnson&Johnson

-0.82

102.96
Medtronic

-0.78

114.70
Microsoft

-0.53

111.63
Wal-Mart

-0.27

99.19
Washington Post

0.83

103.41
Wrigley

0.64

116.17

Daily recap for the 10 Stocks that make up The LISA Portfolio
Stock

% Change

Value
3M

-0.39

111.06
Coca-Cola

-0.38

106.66
Daimler-Chrysler AG

-1.98

118.68
Home Depot

-1.00

104.90
Humana

-0.23

80.44
Johnson & Johnson

-0.82

102.96
Lowe's Companies

-1.12

105.89
Target

-1.22

105.25
Toyota Motor ADR

-0.90

110.84
Worthington Industries

0.98

101.76

The Seven Stocks in the SoGo 7 Index

Company

% Change

Value

Alleghany Corp (Y)

0.19

125.56
eBay (EBAY)

-1.42

127.93
EMC (EMC)

-0.91

116.79
Expiditors Intl (EXPD)

-0.26

108.48
Fastenal (FAST)

-1.09

97.56
Kinght Trans (KNX)

0.05

110.59
Western Union (WU)

-0.80

128.88

Wednesday, November 22, 2006

Wed 11/22/06 Updates & Dollar Cost Averaging

Since today is 11/22 and the date for the many indices we now use for our basis was 9/22 I thought it would be interesting to determine whether dollar cost averaging would prove to have any benefit for two stocks which have either taken a hit as with Humana (HUM) or stayed relatively unchanged such as Worthington (WOR)

I'll be considering 3 equal investments made on 9/22, 10/22 and 11/22 (or the previous trading day if one of those days falls on a weekend or holiday)

For Worthington the price per share on those dates would have been as follows

09/22 18.16
10/22 16.99
11/22 18.30

The number of shares purchased w/ $50 investments would be

09/22 2.7533 shares
10/22 2.9429 shares
11/22 2.7322 shares

for a total of 8.4284 shares which would be worth $154.24 today this is a gain of 2.8267% or an equivalent of
$102.83 while a single investment of $100 on 9/22 would be worth
$100.77 or a gain of only 0.77%. If we annualize these returns we find the following differences.

Dollar Cost Averaging = 11.31% annualized
Lump Sum Investment = 3.08% annualized
===============================================
Now, we'll consider Humana and, at this point, I don't know what the outcome will be.

For Humana the price per share on the three dates were
09/22 $65.45
10/22 $66.50
11/22 $52.77

Then we'll consider the number of shares bought with equal investments of $33.33, $33.34 & $33.33.

09/22 0.50924 shares
10/22 0.50135 shares
11/22 0.63161 shares

for a total of 1.6422 shares which, at todays close would be worth $86.66
compared to a lump sum investment of $100 on 9/22 which would be worth $80.63

In Summary for HUM
Dollar Cost Average = $86.66 or a loss of 13.34%
Lump Sum Investing = $80.63 or a loss of 19.37%

Two real life examples where dollar cost averaging (DCA) increased gains in one example and reduced losses in another example. From theoretical thinking I believe the only way to lose with dollar cost averaging is if a stock price goes up every single month which, however unlikely, would simply result in a smaller gain with DCA then if the stock were bought with a single lump sum. DCA - it can be a great way to invest!

Major Markets; DWDI, LISA, SPDRs & Diamonds Day Ending Scores
Market

% Change

Value

Dow

+0.04%

12,326.95

S&P 500

+0.23%

1,406.09

NASDAQ

+0.45%

2,465.98

...
DWD Indexes..
DWDI

+0.31

1,071.40

LISA

+0.36

1,056.88

Warm & Fuzzy

+0.15

1,109.74

Ambitious

+1.09

1,067.42

SoGo 7 Index

+0.47

1,172.54

.. .
Benchmark Indicies..
Diamonds DIA

+0.08%

1,053.42

Spiders SPY

+0.20%

1,071.88


Personal Portfolio - Taxable+0.05
Personal Portfolio - Retirement+0.42
Skip's List+0.46

Daily recap for the 10 Stocks that make up the Dollar Wise Decisions Index (DWDI)
Stock

% Change

Value
Anheuser-Busch

0.32

98.66
Biomet

0.45

118.37
Fastenal

0.29

98.74
Home Depot

0.47

105.95
Johnson&Johnson

0.26

104.39
Medtronic

0.60

115.60
Microsoft

0.00

112.23
Wal-Mart

0.46

99.46
Washington Post

-0.28

102.56
Wrigley

0.50

115.43


Daily recap for the 10 Stocks that make up The LISA Portfolio
Stock

% Change

Value
3M

-0.21

111.50
Coca-Cola

0.23

107.07
Daimler-Chrysler AG

0.82

121.08
Home Depot

0.47

105.95
Humana

0.57

80.63
Johnson & Johnson

0.26

104.39
Lowe's Companies

-1.11

107.09

Target

1.23

106.55
Toyota Motor ADR

1.23

111.85
Worthington Industries

0.11

100.77


The Seven Stocks in the SoGo 7 Index

Company

% Change

Value

Alleghany Corp (Y)

0.11

125.32
eBay (EBAY)

0.65

129.77
EMC (EMC)

2.80

117.86
Expiditors Intl (EXPD)

-0.57

108.75
Fastenal (FAST)

0.29

98.64
Kinght Trans (KNX)

-0.05

110.53
Western Union (WU)

-0.04

129.91

Tuesday, November 21, 2006

Tue 11/21/06 Updates

Verizon, Medtronics & Juniper were all upgraded today. Medtronics was up 9.4% today which seems to emphasize a general concept I wrote about in a previous article, namely the rule to hold for the long term because you never know when the big days are going to hit.


Major Markets; DWDI, LISA, SPDRs & Diamonds Day Ending Scores
Market

% Change

Value

Dow

+0.04%

12,321.59

S&P 500

+0.16%

1,402.81

NASDAQ

+0.09%

2,454.84

...
DWD Indexes..
DWDI

+0.68

1,068.07

LISA

+0.11

1,053.09

Warm & Fuzzy

+0.68

1,108.38

Ambitious

-0.06

1,056.66

SoGo 7 Index

+0.59

1,167.20

.. .
Benchmark Indicies..
Diamonds DIA

+0.02%

1,052.56

Spiders SPY

+0.10%

1,069.75


Personal Portfolio - Taxable+0.12
Personal Portfolio - Retirement+0.23
Skip's List-0.77


Daily recap for the 10 Stocks that make up the Dollar Wise Decisions Index (DWDI)
Stock

% Change

Value
Anheuser-Busch

-0.37

98.35
Biomet

-0.37

117.84
Fastenal

-0.79

98.45
Home Depot

-1.28

105.45
Johnson&Johnson

-0.61

104.13
Medtronic

9.40

114.91
Microsoft

0.10

112.23
Wal-Mart

0.19

99.00
Washington Post

-0.49

102.85
Wrigley

0.18

114.85


Daily recap for the 10 Stocks that make up The LISA Portfolio
Stock

% Change

Value
3M

0.89

111.73
Coca-Cola

-0.11

106.82
Daimler-Chrysler AG

-0.40

120.10
Home Depot

-1.28

105.45
Humana

-0.46

80.17
Johnson & Johnson

-0.61

104.13
Lowe's Companies

0.33

108.29
Target

-0.33

105.25
Toyota Motor ADR

-0.37

110.49
Worthington Industries

1.22

100.66

The Seven Stocks in the SoGo 7 Index

Company

% Change

Value

Alleghany Corp (Y)

0.15

125.18
eBay (EBAY)

1.51

128.93
EMC (EMC)

1.26

114.64
Expiditors Intl (EXPD)

1.01

109.38
Fastenal (FAST)

-0.79

98.35
Kinght Trans (KNX)

0.61

110.59
Western Union (WU)

0.18

129.97

Mon 11/21/06 Updates

Proctor & Gamble (PG) and Microsoft (MSFT) were both upgraded today.
Concerning the EEEFKWY index, I'll probably be changing the name to the SoGo Index since SoGoInvest.com is where I'm holding those seven stocks.

Major Markets; DWDI, LISA, SPDRs & Diamonds
Day Ending Scores

Market

% Change

Value

Dow

-0.21%

12,317.02

S&P 500

-0.05%

1,400.50

NASDAQ

+0.28%

2,452.72

...
DWD Indexes..
DWDI

+0.13

1,061.79

LISA

-0.52

1,054.89

Warm & Fuzzy

-0.12

1,101.77

Ambitious

+0.01

1,057.51

EEEFKWY

-0.47

1,160.44

.. .
Benchmark Indicies..
Diamonds DIA

-0.11%

1,052.39

Spiders SPY

+0.06

1,068.69

Personal Portfolio - Taxable-0.50
Personal Portfolio - Retirement-0.15
Skip's List-0.08


Daily recap for the 10 Stocks that make up the Dollar Wise Decisions Index (DWDI)
Stock

% Change

Value
Anheuser-Busch

-0.75

98.71
Biomet

-0.70

118.28
Fastenal

0.99

99.24
Home Depot

0.34

106.81
Johnson&Johnson

-0.34

104.77
Medtronic

0.49

105.04
Microsoft

1.67

112.11
Wal-Mart

0.46

98.82
Washington Post

0.11

103.36
Wrigley

-0.85

114.65


Daily recap for the 10 Stocks that make up The LISA Portfolio
Stock

% Change

Value
3M

-0.02

111.38
Coca-Cola

-0.47

106.93
Daimler-Chrysler AG

0.34

120.58
Home Depot

-1.24

106.81
Humana

-0.34

80.54
Johnson & Johnson

0.33

104.77
Lowe's Companies

0.55

107.94
Target

-3.43

105.60
Toyota Motor ADR

0.56

110.90
Worthington Industries

0.56

99.45


Company

% Change

Value

Hi/Low

eBay (EBAY)

-1.75

127.01
EMC (EMC)

-0.31

113.21
Expiditors Intl (EXPD)

0.21

108.29
Fastenal (FAST)

0.99

99.13
Kinght Trans (KNX)

-1.68

109.92
Western Union (WU)

0.75

129.74
Alleghany Corp (Y)

0.30

125.00

Sunday, November 19, 2006

S&P Indices - Part 2

Now that we have an overall view of the S&P Indices for Large, Medium and Small companies we will now consider the other basic four Indices which are simply derived from the first three. Afterwards we'll show the top 10 holdings and sector allocation for the S&P 500, 600 & 400.

S&P 100
The S&P 100, often known by its ticker symbol OEX, measures large-cap company performance. This market capitalization weighted index is a subset of the S&P 500, and is made up of 100 major, blue chip companies across diverse industry groups.

S&P 900
The S&P 900 is a combination of the already widely used S&P 500 and S&P MidCap 400 indices, where the S&P 500 represents approximately 92% of the index and the S&P MidCap 400 represents 8%. The combination of these two indices addresses the needs of those investors who wish to allocate assets to a broader large-cap universe, beyond the S&P 500.

S&P 1000
The S&P 1000 is a combination of the already widely followed S&P MidCap 400 and S&P SmallCap 600 indices, where the S&P MidCap 400 represents approximately 70% of the index and the S&P SmallCap 600 represents 30%. The combination addresses the needs of investors who want to allocate assets between large capitalization stocks and the rest of the investable market.

S&P Composite 1500
Combining the S&P 500, S&P MidCap 400, and S&P SmallCap 600 indices is an efficient way to create a broad market portfolio representing 90% of U.S. equities. This combination addresses the needs of investors wanting broader exposure, beyond the S&P 500. The S&P Composite 1500 is gaining ground amongst plan sponsors as an effective measure of the U.S. equities market.

Saturday, November 18, 2006

S&P Indices - Part 1

From what I've seen there are dozens & dozens of indices provided by Standard & Poors (S&P) but, as an introductory blogging about these indicies we only need to consider seven of them as follows;

S&P 100
S&P 400
S&P 500
S&P 600
S&P 900
S&P 1000
S&P 1500

Essentially these seven are all composed from the following three indices

S&P 500
S&P 400
S&P 600

You may notice I did not list these three with the number portion of the index name increasing but, I did list them in order of size of stock they represent. For ease of understanding, one may think of stocks as coming in three sizes; small, medium and large. When we refer to size we are talking about Market Capitalization (Market Cap) which is the number of shares available for purchase times the price per share and then we may refer to stocks as being either Large Cap, Mid Cap or Small Cap

S&P 500 - Large Cap
S&P 400 - Mid Cap
S&P 600 - Small Cap

Now, you may know what it means to order a small, medium or large drink at McDonald's (MCD) but not so familiar with what those same terms refer to when referring to stocks so we shall elaborate with another brief list

S&P 500 - Large Cap - 4 billion and up
S&P 400 - Mid Cap - 1 to 4.5 billion
S&P 600 - Small Cap - 300 million to 1 billion

Also, we should mention that the number associated with each index (500, 400 or 600) actually refers to the specific number of stocks tracked with each index.

What you may notice if you actually look at the stocks in each index and it's corresponding market cap is that, for example, you will find mid cap stocks ranging from 400 million to 10 billion. This is due to the dynamic nature of stocks. Some will increase in value while others decrease. Non-the-less the initial Market Cap criteria considered by S&P is as stated above.

Another aspect of these indicies is the percentage of the total US market they represent. What's remarkable about the S&P 500 index is that even though there are literally thousands upon thousands of stocks available for purchase, the 500 stocks in the S&P 500 represent about 80% of the value of the total US stock market. To summarize;

S&P 500 - represents about 80% of total US value
S&P 600 - represents about 7% of total US value
S&P 400 - represents about 3% of total US value

Stay tuned for Part 2!

Tuesday, November 14, 2006

Tue 11/14/06 Updates & New EEEFKWY Index

I've changed the AEFKY index to EEEFKWY which is based on an actual set of stocks I've acquired over the last month or so. Apollo Group sucked but I learned some valuable things along the way to finally selling that holding. The current holdings are as follows

eBay
EMC
Expiditors International
Fastenal
Knight Transportation
Western Union
Alleghany

Major Markets; DWDI, LISA, SPDRs & Diamonds
Day Ending Scores
Market

% Change

Value

Dow

+0.71%

12,218.01

S&P 500

+0.64%

1,392.22

NASDAQ

+1.01%

2,430.66

...
DWD Indexes..
DWDI

+0.99

1,059.41

LISA

+1.93

1,056.55

Warm & Fuzzy

+0.79

1,101.69

Ambitious

+1.02

1,043.26

EEEFKWY

+0.70

1,166.56

.. .
Benchmark Indicies..
Diamonds DIA

+0.80%

1,045.47

Spiders SPY

+0.75%

1,061.99


Personal Portfolio - Taxable+0.68
Personal Portfolio - Retirement+1.20
Skip's List+0.40

Daily recap for the 10 Stocks that make up the Dollar Wise Decisions Index (DWDI)
Stock

% Change

Value
Anheuser-Busch

0.21

99.83
Biomet

1.20

120.61
Fastenal

0.95

97.98
Home Depot

4.29

105.56
Johnson&Johnson

0.94

104.07
Medtronic

0.12

105.06
Microsoft

-0.07

109.63
Wal-Mart

2.89

98.69
Washington Post

-0.75

102.57
Wrigley

0.19

115.41

Daily recap for the 10 Stocks that make up The LISA Portfolio
Stock

% Change

Value
3M

0.74

109.61
Coca-Cola

0.30

105.82
Daimler-Chrysler AG

1.08

119.80
Home Depot

4.29

105.56
Humana

-0.11

82.09
Johnson & Johnson

0.94

104.07
Lowe's Companies

4.24

106.71
Target

2.42

107.90
Toyota Motor ADR

3.26

116.64
Worthington Industries

1.59

98.35

Company

% Change

Value

Hi/Low

eBay (EBAY)

0.67

126.55
EMC (EMC)

1.01

113.30
Expiditors Intl (EXPD)

0.63

108.22
Fastenal (FAST)

-0.57

97.88
Kinght Trans (KNX)

0.95

112.34
Western Union (WU)

1.36

134.99
Alleghany Corp (Y)

0.77

123.31

Monday, November 13, 2006

Mon 11/13/06 Updates & JCPenney Analysis

Mom asked me about JCPenney (stock symbol JCP) today and it's quite an interesting stock to consider. For one thing JCP has a rating of one star from Morningstar (M*) which doesn't matter because of the behavior of the fair value estimates over the last five years. The M* rating is only a representation of the relative difference between a percieved fair value for a stock and it's actual trading price. If the perception is a fair value below the actual trading price then the star rating can be low, like a one but, if the fair value is above the actual trading price then the rating will be high, like a 4 or 5.
A case where a five star rating doesn't mean squat would be with a company like Apollo Group (APOL) which is rated 5 stars but it's fair value has been going down - along with it's stock price. At the end of 2004 APOL had a fair value of $114/share when it was trading for a high of $84.83 so, it was rated five stars. Unfortunately, the fair value has dropped 5 times since then to it's current $65 estimate & actual trading price of $34.05/share.

JCP is a one star stock which hit a low of $9.63 in November of 2000 and has risen to it's very stately per share price of $78.74 as of close today. We can only research past fair values for five years but, in November of 2001 M* had JCP's fair value estimated at $21/share when it was trading around $25.
If you plot the fair value estimate (FVE) on a graph you'll see straight flat lines which stay flat until the FVE changes, either for better or words, then you'll see that line jump or fall accordingly while the actual stock price, on the other hand, constantly goes up and down. Until about November of 2003 the FVE of JCP was above the actual trading price two periods and below it a couple times so the M* rank varied but since November of 2003 the FVE has been below the actual trading price so the rating remains a one.

BUT - in the past five years the FVE of JCP has risen eight times!
So, this is a fine example of when a 1 star rated stock is far superior to a 5 star rated stock.


So, we have here a stock that's gone up 717.6% in the past 6 years ...quite impressive and makes me have to look at the technicals of the stock; that includes things like the MSCD Oscillator, Bollinger Bands and Parabolic Time/Price ratios - basically things most people have never heard of but, we can break it down into easily understandable terms

Short Term Indicators - 80% Buy
Medium Term Indicators - 100% Buy
Long Term Indicators - 100% Buy

I'm thinking to myself that I *did* need to add a Consumer Services type of stock to my portfolio and I'm thinking maybe Mom just found one for me!

JCP has Average business risk and no economic moat but, it does have a Stewardship Grade of B. What's really impressive, to me, is the P/E ratio is only hat 17.90! How does a stock go up over 700% and still maintain a P/E ratio under 20? ....gotta be increasing revenues, right?

Well, took a while with the M* stock screener but I did find that JCPenney has had increasing revenues and positive earnings per share for the past two years. I thought it might have been a bit longer than two years.

Below we have an Analysis from M*

JCP Thesis by Kimberly Picciola 05-23-2006
J.C. Penney is returning to growth mode with plans to add 175 off-mall locations by 2009. Additionally, the company has partnered with cosmetics retailer Sephora to sell more high-end cosmetic products in its stores. Although we think J.C. Penney will continue to face tough competition, we now view its growth prospects over the next three to four years more favorably.

Consolidation was rampant among department stores in 2005, and J.C. Penney is hoping to benefit from its competitors' distractions. As Sears SHLD focuses on moving its merchandise off the mall and Federated focuses on moving its merchandise off the mall and Federated FD
integrates May into its business, J.C. Penney is making a move to lure middle-income consumers back to its stores. Its solid performance in recent quarters indicates that this almost forgotten department store chain is making progress.

The turnaround plan, initiated in early 2001, has focused on reconnecting J.C. Penney with its target consumer, improving the in-store shopping experience, and centralizing functions, such as merchandising, to reduce costs and improve efficiency. Thanks to this effort, the top line has grown, operating margins have risen consistently, and inventory is under better control. We anticipate margins will show modest improvements over the next five years as J.C. Penney continues to benefit from its restructuring efforts and its additional off-mall locations.

Although J.C. Penney's recent operating margin expansion and comparable-store sales results have been impressive, we believe the retail environment remains challenging. The department store chain will have a tough time keeping its customers from shopping more at Kohl's KSS
and Target TGT. Over the past five years, these two off-mall chains have expanded while J.C. Penney has closed more stores than it has opened. Although J.C. Penney plans to increase its square footage over the next five years, it has a lot of ground to cover to catch up to its closest competitors.

In addition to competing with off-mall retailers, J.C. Penney is up against other traditional department stores and specialty retailers, which have flourished recently. Despite being a retailer for more than 100 years, J.C. Penney hasn't created an economic moat to keep competitors at bay, in our opinion. We think the battle for the moderate consumer's discretionary income will continue making it difficult for J.C. Penney to develop a sustainable competitive advantage.

Valuation
After incorporating J.C. Penney's expansion plans into our model, we are increasing our fair value estimate to $55 per share. The company plans to add 175 off-mall locations by 2009. Combining this with anticipated same-store sales growth in the low single digits, we think total revenue will grow at an annual rate of 5%, on average, over the next five years. As a result of growth in off-mall locations (which we believe are less costly to operate than mall-based stores), we expect operating margins to reach around 9.5% by 2009. Although management expects 10%-10.5% operating margins by 2009, we are not quite as optimistic. We think continued competitive pressure from Kohl's, Target, and Federated will make it challenging for J.C. Penney to gain the operating leverage necessary to hit management's margin targets. Additionally, the retailer remains vulnerable to a challenging macro environment and fickle consumers who have a growing number of choices when it comes to apparel, home fashions, and other discretionary goods. If we did assume operating margins hit 10% by 2009, our fair value estimate would be upward of $60 per share.

Risk
J.C. Penney faces a tough competitive environment. Not only is Target upgrading its apparel assortment to appeal to a more middle-income consumer, but Federated will have a national brand under the Macy's nameplate at the end of 2006, strengthening its position in the traditional department store sector. Any merchandising missteps or execution mishaps could limit J.C. Penney's ability to generate positive same-store sales growth and increase profits.

Strategy
After years of operating practices that hurt sales growth and profitability, J.C. Penney has emerged from its turnaround with more centralized decision-making to reduce operating expenses and improve efficiency. The company is focused on optimizing its merchandising mix, refining its in-store presentation, and expanding its off-mall store base.

Management & Stewardship
Myron "Mike" Ullman became chairman and CEO in December 2004. He has a strong background in retail, including group managing director of LVMH Moet Hennessy Louis Vuitton and chairman and CEO of the Macy's department store chain in the early 1990s. His total compensation in 2005 was nearly $4.8 million (with the majority of it variable and based on the company's performance), which we think is reasonable given J.C. Penney's solid performance under his leadership. While there is a long-term component to his compensation, we don't think the goals associated with it were clearly outlined in the proxy. We like that 10 of the 11 board members are independent, and we applaud the board for listening to its shareholders and putting members up for election annually, rather than every three years. With the change to elect directors on an annual basis, we have a more favorable view of J.C. Penney's corporate governance. Overall, we think it is above average.

Profile
J.C. Penney operates more than 1,000 department stores in the United States and Puerto Rico. Additionally, it sells its merchandise and services through its catalog and Web site, which hit the $1 billion sales mark in 2005. Around 40% of its merchandise is private label and includes exclusive brands such as St. John's Bay, Arizona, and the Chris Madden home collection.

Growth
Sales growth has been anemic for years because of a sizable disconnect between strategy and execution. We expect the company will generate average annual growth of around 5% over the next five years, driven by low-single-digit growth in same-store sales and 3% square footage growth.

Profitability
Returns on equity and assets have improved since the turnaround plan was initiated in early 2001. Management hopes to continue this trend by paring inventory and improving product selection.

Financial Health
The company used cash from the sale of the Eckerd drugstore chain to pay down debt and shore up its balance sheet. With operational improvements, J.C. Penney's financial health should continue to improve.


Major Markets; DWDI, LISA, SPDRs & Diamonds
Day Ending Scores

Market

% Change

Value

Dow

+0.19%

12,131.88

S&P 500

+0.25%

1,338.42

NASDAQ

+0.70%

2,406.38

...
DWD Indexes..
DWDI

-0.44

1,049.65

LISA

+0.08

1,036.81

Warm & Fuzzy

-0.06

1,093.43

Ambitious

+0.79

1,033.28

AEFKY

0.40

1,014.12

.. .
Benchmark Indicies..
Diamonds DIA

+0.20%

1,037.18

Spiders SPY

+0.25%

1,054.08


Personal Portfolio - Taxable+0.06
Personal Portfolio - Retirement+0.47
Skip's List+0.32


Daily recap for the 10 Stocks that make up the Dollar Wise Decisions Index (DWDI)

Stock

% Change

Value
Anheuser-Busch

-0.68

99.62
Biomet

-1.71

119.18
Fastenal

0.68

97.06
Home Depot

-0.66

101.22
Johnson&Johnson

-0.53

103.10
Medtronic

-0.12

104.93
Microsoft

0.38

110.09
Wal-Mart

-0.32

95.92
Washington Post

-0.14

103.34
Wrigley

-1.03

115.18


Daily recap for the 10 Stocks that make up The LISA Portfolio

Stock

% Change

Value
3M

0.39

108.80
Coca-Cola

-0.13

105.50
Daimler-Chrysler AG

0.36

118.52
Home Depot

-0.66

101.22
Humana

3.44

82.19
Johnson & Johnson

-0.53

103.10
Lowe's Companies

-0.58

102.36
Target

-0.31

105.34
Toyota Motor ADR

-0.77

112.96
Worthington Industries

0.29

96.81

Friday, November 10, 2006

Fri 11/10/06 Updates

I'm not sure I give a rat's a$$ about these upgrades and downgrades ...today, for example, I see that Whole Foods (WFMI) was upgraded and I know for a fact that same company was downgraded within the last 30 days by some other brokerage firm.
I also know that WFMI happens to be on Jubaks list of the 50 greatest companies to own. I must say I'm a bit more interested in the intrinsic value of these companies especially since I am a long term investor.

The best company we've been tracking is Western Union (WU) (which I just added to my personal portfolio last week) - WU is part of the Warm & Fuzzy index and is up 31.59% since Sept 22, 2006. In fact, 16 of the 18 companies in teh WARM index have appreciated in value since 9/22. Amazingly enough, WU is still rated 5 stars by M* with a Consider Buying Price of $27.30 and a fair value estimate of $32/share. WU closed today at $22.83

Major Markets; DWDI, LISA, SPDRs & Diamonds
Day Ending Scores

Market

% Change

Value

Dow

+0.04%

12,108.43

S&P 500

+0.19%

1,380.90

NASDAQ

+0.58%

2,389.72

...
DWD Indexes..
DWDI

+0.19

1,054.34

LISA

+0.07

1,036.11

Warm & Fuzzy

+0.36

1,094.19

Ambitious

+0.60

1,025.33

AEFKY

+0.56

1,010.10

.. .
Benchmark Indicies..
Diamonds DIA

-0.04%

1,035.13

Spiders SPY

+0.04%

1,051.49


The LISA Portfolio would be up 0.20% w/o HUM

Personal Portfolio - Taxable-0.06
Personal Portfolio - Retirement+0.42
Skip's List+0.73


Daily recap for the 10 Stocks that make up the Dollar Wise Decisions Index (DWDI)

Stock

% Change

Value
Anheuser-Busch

0.13

100.30
Biomet

3.11

121.26
Fastenal

-0.81

96.40
Home Depot

-0.57

101.89
Johnson&Johnson

0.21

103.64
Medtronic

-0.12

105.06
Microsoft

-0.07

109.68
Wal-Mart

0.17

96.23
Washington Post

0.21

103.49
Wrigley

-0.82

116.39


Daily recap for the 10 Stocks that make up The LISA Portfolio

Stock

% Change

Value
3M

0.37

108.38
Coca-Cola

-0.39

105.64
Daimler-Chrysler AG

0.19

118.10
Home Depot

-0.57

101.89
Humana

-1.44

79.45
Johnson & Johnson

0.21

103.64
Lowe's Companies

0.24

102.96
Target

2.42

105.67
Toyota Motor ADR

-0.47

113.84
Worthington Industries

-0.23

96.53

Thursday, November 09, 2006

Thur 11/09/06 Updates & LISA Analysis

The LISA Portfolio
This is actually one of the best portfolios being tracked. Keep in mind, the Dollar Wise Decisions Index was created using various stock screens & analysts reports while the LISA Portfolio (LP)was a selection of stocks of the top of her (Lisa's) head. Also, the original LP included the Canadian Oil Sands Trust (COS.UN) also traded on the pink sheets under COSWF.

On May 5, 2006 Humana (HUM) closed at $41.80 and ran all the way up to $67.52 on Sept 21, 2006 - that's a gain of 61.53% in less than 4 months! That's an annualized return over 185% but, as fate would have it, the LP cost basis was taken the very day after it's peak, on Sept 22, 2006. So, even though HUM is down about 20% since index inception, it's still 40% above where it was this past May - the stock is a mover!

If HUM is removed from the LP we would have a value today of $1,060.91, a gain of about 6.1% which exceeds the DWDI by about 8+%. HUM has a 10 year average return over 12%

DiamlerChrysler & Toyota are up the most; 17.88% and 14.4% respectively.

The only other stock below it's inital $100 cost basis is Worthington Industries (WOR) which sort of had a similar stock chart as HUM in that WOR was at a low of 16.36 in June then ran up to 21.74 in July, a gain of 33% in under a month (close to 400% annualized)
WOR is back down around it's yearly low and over the last 3 years spent much of it's time in the $18.50 - $21 range.

WOR was rated by Fortune magazine as one of the 100 Best companies to work for in 2006 and ranked #1 in it's industry as most admired company. The stock pays about a 4% dividend and can be accumulated via a DRIP where all purchases are free to the shareholder - overall a pretty nice deal and ...the only stock in the LP which actually went up today. Nice Diversification!

UPGRADES
Urban Outfitters (URBN) Hold to Buy
Cisco Systems (CSCO) Neutral to Buy
Sonic Solutions (SNIC) Neutral to Overweight
NetBank (NTBK) Underperform to Mkt Perform

Downgrades
Allegheny Energy (AYE) Buy to Hold
New York Times (NYT) Equal-Weight to Underweight
Harley-Davidson (HOG) Buy to Hold - 2x
Lowe's (LOW) Buy to Hold
Sirius Satellite (SIRI) Outperform to Mkt Perform

Major Markets; DWDI, LISA, SPDRs & Diamonds
Day Ending Scores

Market

% Change

Value

Dow

-0.60%

12,103.30

S&P 500

-0.53%

1,378.33

NASDAQ

-0.37%

2,376.01

...
DWD Indexes..
DWDI

-0.92

1,052.49

LISA

-1.30

1,035.44

Warm & Fuzzy

-0.50

1,090.46

Ambitious

-0.91

1,019.32

AEFKY

-1.12

1,004.88

.. .
Benchmark Indicies..
Diamonds DIA

-0.55%

1,035.55

Spiders SPY

-0.53%

1,051.04


Personal Portfolio - Taxable-0.96
Personal Portfolio - Retirement-0.43
Skip's List-0.88


Daily recap for the 10 Stocks that make up the Dollar Wise Decisions Index (DWDI)

Stock

% Change

Value
Anheuser-Busch

0.00

100.17
Biomet

-1.35

117.60
Fastenal

-2.61

97.19
Home Depot

-1.07

102.48
Johnson&Johnson

-2.71

103.43
Medtronic

-0.87

105.19
Microsoft

0.97

109.75
Wal-Mart

-1.36

96.06
Washington Post

-0.23

103.28
Wrigley

-0.21

117.35


Daily recap for the 10 Stocks that make up The LISA Portfolio

Stock

% Change

Value
3M

-0.65

107.98
Coca-Cola

-0.49

106.04
Daimler-Chrysler AG

-0.56

117.88
Home Depot

-1.07

102.48
Humana

-4.40

80.61
Johnson & Johnson

-2.71

103.43
Lowe's Companies

-1.42

102.72
Target

-1.86

103.17
Toyota Motor ADR

-0.87

114.37
Worthington Industries

0.29

96.75

Analyst Report on Graco (GGG)

Analyst Report on Graco (GGG)
Graco makes equipment used to handle all kinds of sticky situations, from spraying pizza sauce in a food-processing plant to paint in an auto factory. This narrow-moat firm fiercely protects its technological advantage.

Users of viscous materials--professional painters, manufacturers, and quick-lube companies--are likely to use Graco equipment. The finishing touch provided by Graco equipment--furniture stain, for example--is highly visible to the end user, yet represents only a small portion of production costs. Graco maintains an impeccable record of precision performance, which facilitates premium pricing in this niche industry.

To maintain its cachet with demanding customers, Graco regularly reinvests 3%-4% of its revenue in research and development. The results speak for themselves. For example, Graco's paint-circulation equipment is used in 80% of worldwide auto production, a dominant position that allows the firm to capture industry growth around the globe. Regular product advancements stave off commodification and drive replacement business from existing customers.

Because of the relatively small size of its markets, new entrants could never achieve sales figures that would justify the investment required to match Graco's capabilities. The larger threat comes from industry players like Illinois Tool Works (ITW), Ingersoll-Rand (IR), and Nordson (NDSN)--all of which run somewhat similar businesses and would like to siphon off share. Graco's position elicits such envy because of its stellar returns: Operating margins continue to march beyond 25%. Aside from dominant market share and the resulting scale benefits, Graco controls costs by stressing lean manufacturing techniques and efficiency gains at the corporate office.

Also, this business quite naturally fits the razor-and-blade business model. Spraying abrasive fluids through a plastic gun creates constant wear and tear. Consumable parts and accessories, which make up 40% of total sales, contribute higher margins and help smooth out cyclical demand for the firm's products. For the customer, diligent maintenance ensures consistent performance and prevents costly waste of material. Though small in the grand scheme, Graco posts giant returns.

Valuation
Our fair value estimate for Graco is $43 per share. We expect 7% compound annual sales growth over the next five years, as Graco capitalizes on rapid growth in overseas markets. The firm is gaining share in Europe and growing on the back of developing economies. Further, we expect operating margins to expand to roughly 30% before retrenching to our 27% midcycle assumption. With Graco's all-equity capital structure, we use a 9.5% cost of capital to discount projected cash flows.

Risk
Graco's high margins and market share will continue to attract competitive advances from industrial powerhouses Illinois Tool Works and Ingersoll-Rand. Both firms compete with portions of Graco's product portfolio.

Stock Price $38.38 (as of 8/15/06)
Fair Value Estimate $43.00
Consider Buying Price $33.20
Consider Selling Price $53.90

Business Risk - Average
Economic Moat - Narrow
Stewardship Grade - B

Wed 11/08/06 Updates

UPGRADES/Downgrades
Urban Outfitters (URBN) and Whole Foods (WFMI) were Upgraded today which is a little odd because I saw Urban Outfitters just downgraded yesterday nad was sure Whole Foods got downgraded a little while ago

URBN has shown up on a few of my M* searches and WFMI is listed by Jubak (MSN Money) as one of the 50 greatest stocks to own (long term)

Downgrades today include Raytheon (RTN), Intel (INTC), Sotheby's (BID), Verizon (VZ) and Emerson.

Major Markets; DWDI, LISA, SPDRs & Diamonds
Day Ending Scores

Market

% Change

Value

Dow

+0.16%

12,176.46

S&P 500

+0.21%

1,385.72

NASDAQ

+0.38%

2,384.94

...
DWD Indexes..
DWDI

-0.28

1,062.37

LISA

-0.08

1,049.19

Warm & Fuzzy

-0.10

1,096.44

Ambitious

+0.07

1,029.05

AEFKY

-0.57

1,016.40

.. .
Benchmark Indicies..
Diamonds DIA

+0.23%

1,041.28

Spiders SPY

+0.22%

1,056.59


Personal Portfolio+0.26
Skip's List+0.33


Daily recap for the 10 Stocks that make up the Dollar Wise Decisions Index (DWDI)

Stock

% Change

Value
Anheuser-Busch

0.06

100.17
Biomet

-0.60

119.21
Fastenal

0.42

99.79
Home Depot

0.05

103.59
Johnson&Johnson

-1.05

106.30
Medtronic

-0.12

106.11
Microsoft

0.10

108.70
Wal-Mart

-1.30

97.39
Washington Post

0.10

103.51
Wrigley

-0.45

117.59


Daily recap for the 10 Stocks that make up The LISA Portfolio

Stock

% Change

Value
3M

0.00

108.69
Coca-Cola

-0.06

106.57
Daimler-Chrysler AG

1.31

118.54
Home Depot

0.05

103.59
Humana

-5.90

84.32
Johnson & Johnson

-1.05

106.30
Lowe's Companies

0.65

104.20
Target

0.56

105.12
Toyota Motor ADR

1.86

115.37
Worthington Industries

0.34

96.48

Wednesday, November 08, 2006

Tue 11/07/2006 Updates

Upgrades -
Willmington Trust
Red Robin
H&R Block

Downgrades-
Urban Outfitters
Elizabeth Arden
Con Edison


Major Markets; DWDI, LISA, SPDRs & Diamonds
Day Ending Scores

Market

% Change

Value

Dow

+0.43%

12,157.15

S&P 500

+0.22%

1,382.84

NASDAQ

+0.42%

2,375.88

...
DWD Indexes..
DWDI

+0.22

1,065.41

LISA

+0.26

1,050.41

Warm & Fuzzy

+0.07

1,097.65

Ambitious

+1.00

1,028.50

AEFKY

+0.08

1,022.50

.. .
Benchmark Indicies..
Diamonds DIA

+0.45%

1,038.89

Spiders SPY

+0.38%

1,054.31


Personal Portfolio+0.80
Skip's List+0.15


Daily recap for the 10 Stocks that make up the Dollar Wise Decisions Index (DWDI)

Stock

% Change

Value
Anheuser-Busch

0.81

100.11
Biomet

0.42

119.92
Fastenal

0.08

99.37
Home Depot

0.03

103.53
Johnson&Johnson

0.42

107.43
Medtronic

-0.16

106.24
Microsoft

0.38

108.59
Wal-Mart

0.34

98.67
Washington Post

0.00

103.41
Wrigley

0.42

118.13


Daily recap for the 10 Stocks that make up The LISA Portfolio

Stock

% Change

Value
3M

-0.21

108.69
Coca-Cola

0.23

106.66
Daimler-Chrysler AG

-0.96

117.00
Home Depot

0.03

103.53
Humana

0.26

89.61
Johnson & Johnson

0.42

107.43
Lowe's Companies

1.77

103.53
Target

0.21

104.54
Toyota Motor ADR

1.24

113.27
Worthington Industries

-0.29

96.15

Tuesday, November 07, 2006

Mon 11/06/06 Updates

Express Scripts (ESRX) was upgraded yesterday by Wachovia from Mkt Perform to Outperform while both
Home Depot (HD) and Lowes (LOW) were downgraded by UBS from Neutral to Reduce
Intel (INTC)was also downgraded from Mkt Perform to Underperform
Tuesday Morning (TUES)was downgraded from Outperform to Mkt Perform
Duke Energy (DUK) downgraded from Outperform to Mkt Perform

Generally speaking, the market roared yesterday.

Major Markets; DWDI, LISA, SPDRs & Diamonds
Day Ending Scores

Market

% Change

Value

Dow

+1.00%

12,106.39

S&P 500

+1.13%

1,379.78

NASDAQ

+1.51%

2,365.95

...
DWD Indexes..
DWDI

+0.55

1,063.73

LISA

+1.22

1,047.70

Warm & Fuzzy

+1.14

1,097.27

Ambitious

+1.41

1,018.52

AEFKY

+2.08

1,021.84

.. .
Benchmark Indicies..
Diamonds DIA

+1.03%

1,034.27

Spiders SPY

+1.13%

1,050.28


Personal Portfolio+2.01
Skip's List+1.46


Daily recap for the 10 Stocks that make up the Dollar Wise Decisions Index (DWDI)

Stock

% Change

Value
Anheuser-Busch

0.98

100.55
Biomet

0.60

119.43
Fastenal

1.07

99.29
Home Depot

0.05

103.51
Johnson&Johnson

0.90

106.97
Medtronic

1.18

106.42
Microsoft

0.38

108.18
Wal-Mart

-0.08

98.34
Washington Post

-0.19

103.41
Wrigley

0.61

117.64


Daily recap for the 10 Stocks that make up The LISA Portfolio

Stock

% Change

Value
3M

1.29

108.93
Coca-Cola

0.67

106.41
Daimler-Chrysler AG

1.90

118.14
Home Depot

0.05

103.51
Humana

3.01

89.38
Johnson & Johnson

0.90

106.97
Lowe's Companies

-0.79

101.73
Target

2.09

104.32
Toyota Motor ADR

1.76

111.89
Worthington Industries

1.45

96.42

Saturday, November 04, 2006

Fri 11/03/06 updates -

Well ...it looks like my personal portfolio went up 0.03% today which happens to be the only portfolio/index which escaped a negative return today ...ya gotta love it!
But wait - it get's better - my rather portly holding of Compass Minerals (CMP) was upgraded from 3 to 5 stars today and it's fair value rating was raised to around $41/share! This was truly a great pick - CMP is up 29% this year and pays a 4% dividend to boot.

Out of all the various companies being tracked w/ my various indecies there were a couple on my Dads list that did pretty well today in spite of the overall market direction and the one I noticed the most was Walgreen's (WAG) which was up 1.45%
My theory here is that scared money goes to safe places.

I'm also a bit impressed with Biomet which is up 18% since 09/22/06

However, Apollo Group (APOL) is proving to be an abysmal failure and could very well be dropped - without that dog in the AEFKY index we'd be up nearly 8%

Weingarten Realty (WRI) and Zimmer Hldgs (ZMH) were both upgraded by Wachovia today from Underperform to Market Perform

- ERROR - ERROR - PUBLISHING ERROR BELOW -
The tables below contain erroneous information - for some reason the template I use got published and all the updates and changes I made were lost -


Major Markets; DWDI, LISA, SPDRs & DiamondsDay Ending Scores

Market

% Change

Value

Dow

+0.95%

12,116.75

S&P 500

+0.62%

1,377.02

NASDAQ

+0.57%

2,355.56

...
DWD Indexes..
DWDI

+2.30

1,068.97

LISA

+1.10

1,052.64

Warm & Fuzzy

+1.68

1,084.59

Ambitious

+0.88

1,019.85

AEFKY

-0.11

1,024.72

.. .
Benchmark Indicies..
Diamonds DIA

+0.78%

1,033.08

Spiders SPY

+0.46%

1,045.64


Personal Portfolio+0.06
Skip's List+0.78


Daily recap for the 10 Stocks that make up the Dollar Wise Decisions Index (DWDI)

Stock

% Change

Value
Anheuser-Busch

0.57

100.93
Biomet

2.03

110.98
Fastenal

0.12

108.88
Home Depot

0.69

100.78
Johnson&Johnson

0.70

108.04
Medtronic

0.17

104.12
Microsoft

0.07

106.71
Wal-Mart

3.87

106.19
Washington Post

-0.38

103.63
Wrigley

13.67

118.71


Daily recap for the 10 Stocks that make up The LISA Portfolio

Stock

% Change

Value
3M

2.06

109.61
Coca-Cola

1.13

107.48
Daimler-Chrysler AG

0.13

104.64
Home Depot

0.69

100.78
Humana

-0.57

101.02
Johnson & Johnson

0.70

108.04
Lowe's Companies

2.12

109.04
Target

2.97

108.92
Toyota Motor ADR

1.57

109.73
Worthington Industries

-0.18

93.39

Friday, November 03, 2006

Thur 11/02/06 abbreviated updates

Major Markets; DWDI, LISA, SPDRs & Diamonds
Day Ending Scores
Market

% Change

Value

Dow
S&P 500
NASDAQ
...
DWD Indexes..
DWDI

+0.25

1,065.24

LISA

+0.00

1,041.65

Warm & Fuzzy

+0.28

1,090.65

Ambitious

+0.78

1,005.83

AEFKY

-0.32

1,011.44

.. .
Benchmark Indicies..
Diamonds DIA

-0.22%

1,025.64

Spiders SPY

-0.06%

1,040.39

Wednesday, November 01, 2006

Wed 11/01/06 Updates ...hmmmmm

Respironics, RESP upgraded from Hold to Buy by Matrix Research
Honda Motor, HMC upgraded from Neutral to Buy by Bank of America Securities
Martha Stewart, MSO upgraded from Underperform to Neutral by Credit Suisse

This is interesting ...Omnicare (OCR) was upgraded by a couple firms and downgraded by a few more ....let's look at this

OCR Upgraded by ...
Bear Stearns from Peer Perform to Outperform
Stifel Nicolaus from Hold to Buy

OCR Downgraded by
Morgan Stanley from Overweight to Equal-weight
JMP Securities from Mkt Outperform to Mkt Perform

...things that make you go hmmmmm ...


Major Markets; DWDI, LISA, SPDRs & Diamonds
Day Ending Scores

Market

% Change

Value

Dow

12,031.02

S&P 500

1,367.81

NASDAQ

2,334.35

...
DWD Indexes..
DWDI

-0.58

1,062.66

LISA

-0.63

1,041.76

Warm & Fuzzy

-0.72

1,087.72

Ambitious

-1.20

998.32

AEFKY

-1.28

1014.72

.. .
Benchmark Indicies..
Diamonds DIA

-0.39%

1,027.86

Spiders SPY

-0.67%

1,041.00


Personal Portfolio-0.86
Skip's List+0.78


Daily recap for the 10 Stocks that make up the Dollar Wise Decisions Index (DWDI)

Stock

% Change

Value
Anheuser-Busch

0.57

101.15
Biomet

-1.16

116.07
Fastenal

-2.51

103.05
Home Depot

0.05

103.87
Johnson&Johnson

-0.33

105.04
Medtronic

-0.04

104.42
Microsoft

0.35

108.06
Wal-Mart

-0.87

101.16
Washington Post

-2.01

103.84
Wrigley

0.13

116.01


Daily recap for the 10 Stocks that make up The LISA Portfolio

Stock

% Change

Value
3M

0.00

107.90
Coca-Cola

-0.17

106.02
Daimler-Chrysler AG

1.46

115.40
Home Depot

0.05

103.87
Humana

-2.48

89.40
Johnson & Johnson

-0.33

105.04
Lowe's Companies

-1.73

104.55
Target

-2.50

105.23
Toyota Motor ADR

-0.38

109.85
Worthington Industries

-0.69

94.49